Nonprofit Executive Director Statistics 2026: Salary, Tenure, Turnover, and What the Data Reveals
Nonprofit Executive Director Statistics 2026: Salary, Tenure, Turnover, Demographics, and Compensation Data
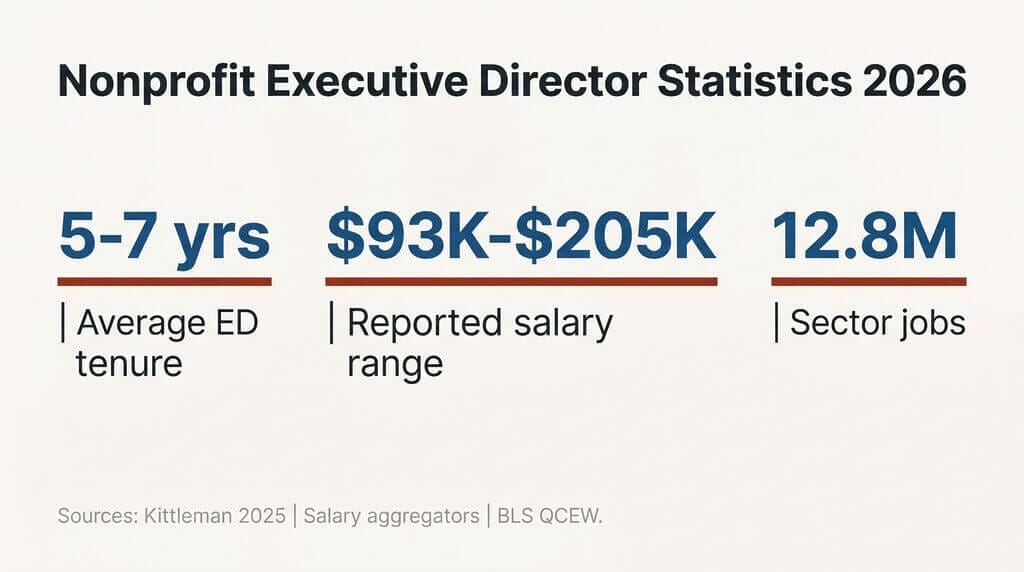
What are the nonprofit executive director statistics?
Nonprofit executive directors serve an average of 5 to 7 years before departing (Daring to Lead 2011). Reported salaries range from $82,000 to $205,000 depending on methodology. Seventy-five percent report significant burnout signals. Fewer than one-third of boards hold a written succession plan. Below 20% of EDs at sub-$1M organizations access professional coaching.
Every figure on this page carries a number, a named source, and a year of collection. Canonical statistics older than five years are labeled historical baselines and the age is flagged at every reference. Salary aggregator estimates that disagree by 2.5x are reconciled by methodology, not blended. The Center for Nonprofit Coaching publishes this page and operates an executive coaching program for nonprofit leaders; that interest is disclosed in the methodology section below.
Data current as of May 2026. Next update: January 2027.
Key Takeaways
- The most-cited nonprofit ED tenure, burnout, and demographic figures are 15+ years old — no comparably scoped national study has replaced them.
- Salary aggregators disagree by 2.5x not because data is bad but because they measure different populations and methodologies entirely.
- Board conflict is a top-three departure driver — often the proximate trigger for resignations rooted in funding misalignment, not personality clashes.
- Coaching access below 20% at sub-$1M organizations is a structural cost barrier, not an awareness problem.
- Burnout is pushing nonprofit executives out of the sector entirely, not just out of their current role.
What are the key statistics for nonprofit executive directors in 2026?
Nonprofit executive directors serve an average of 5 to 7 years sector-wide (Daring to Lead 2011). Reported salaries range from $82,000 to $205,000 depending on data source and methodology. Approximately 75% report burnout signals. Fewer than one-third of nonprofit boards have a written succession plan in place (BoardSource 2024).
About This Statistics Hub: Sources, Methodology, and How to Cite
Every nonprofit executive director statistic on this page is drawn from primary data sources or named studies, with the year of data collection flagged on first reference. Data older than five years is labeled a historical baseline. The Center for Nonprofit Coaching publishes this page and operates an executive coaching program for nonprofit leaders; that commercial interest is disclosed here so readers can weigh it.
Statistical claims on this page draw from the following data sources:
- IRS Form 990 filings aggregated through the Candid nonprofit compensation data set and ProPublica Nonprofit Explorer
- Bureau of Labor Statistics sector employment - see the BLS Quarterly Census of Employment and Wages
- BoardSource Leading with Intent 2024 for governance benchmarks; see BoardSource Leading with Intent (sample skews toward larger, professionally governed organizations)
- CompassPoint Daring to Lead 2011 (15-year historical baseline)
- AECF Transitions Survey 2004 (22-year historical baseline) - see the AECF Nonprofit Executive Leadership and Transitions Survey
- Kittleman 2025 CEO Departures report, Avra Search 2025 hiring trends, and Bridgespan pipeline research
- Building Movement Project Race to Lead 2024 - see Building Movement Project Race to Lead
- ICF Global Coaching Study - see the ICF Global Coaching Study
Suggested citation: Center for Nonprofit Coaching. (2026). Nonprofit executive director statistics 2026. Retrieved [date] from cnpc.coach/nonprofit-executive-director-statistics/. For attribution within a quote, name the underlying study (for example, “Daring to Lead 2011, cited in CNPC 2026”) so the year of the original data is preserved.
Nonprofit Executive Director Turnover and Tenure Statistics
Average nonprofit executive director tenure runs 5 to 7 years sector-wide, with shorter averages at organizations under $250K operating budget (Daring to Lead 2011, 15-year-old data). The Kittleman 2025 CEO Departures report places nonprofit CEO departures at record levels. Time-to-fill an ED vacancy averages 4 to 6 months at the median, with search costs of $25,000 to $50,000 plus interim productivity loss.
Average tenure: 5 to 7 years. The most-cited tenure figure traces to Daring to Lead 2011 (CompassPoint Nonprofit Services, n=3,000 EDs), which reported an average ED tenure of approximately 6 years with variation by organization size. The data is now 15 years old; no comparably scoped national study has replaced it. EDs at nonprofits under $250K reported tenure clustering in the 3 to 5 year range, while EDs at organizations above $5M tended to stay 7 or more years.
Record-level CEO departures. The Kittleman 2025 CEO Departures report describes nonprofit CEO departures at record levels, drawing on Kittleman’s search-firm engagement data. CEO-titled departures cluster at organizations above $5M operating budget. Search-firm reports therefore skew large and may not reflect turnover at the small-to-mid range where most nonprofit EDs work. Roughly one-third of nonprofit chief executives intend to leave their role within two years (Chronicle of Philanthropy 2024 CEO survey, n~350). Avra Search 2025 reports the majority of these planned departures are voluntary resignations rather than retirements, a shift from the patterns AECF documented in 2004 (22-year historical baseline).
Time to Fill and ED vs. CEO Title
Median time-to-fill: 4 to 6 months for organizations using a structured search process; longer for open searches without a search firm or interim leader (Avra Search 2025). Search-firm fees typically run $25,000 to $50,000 for placements at the small-to-mid range, with retained-search engagements at large nonprofits running higher. Those fees buy the search; coaching a nonprofit through the transition is what carries the outgoing leader, the incoming leader, and the board across the handoff a search cannot.
The “CEO” title clusters at organizations above $5M operating budget; the “executive director” title is more common at small and mid-sized nonprofits. When an aggregator or search-firm report blends “executive director or CEO” data without splitting the title, the average tilts upward because the CEO subset overrepresents larger, better-funded organizations. For practical reading guidance on the role, see our companion piece on navigating the executive director role.
Nonprofit Executive Director Compensation and Salary Statistics
Reported nonprofit executive director salaries vary by 2.5x across the four most-cited sources: PayScale ~$82K, ZipRecruiter ~$93K, Candid IRS Form 990 aggregate $115K-$235K, and Glassdoor ~$205K. The spread reflects methodology differences, not measurement error. Nonprofit executive compensation scales with operating budget size; the IRS reasonable-compensation framework requires boards to benchmark against comparable organizations.
Why the Salary Aggregator Range Spans 2.5x
The four most-quoted nonprofit executive director salary figures disagree because they pull from different data sources and different organization populations. Each is internally valid; none can be substituted for another without distortion.
| Source | Reported Avg/Median | Methodology | Data Year |
|---|---|---|---|
| PayScale | ~$82,000 | Self-reported salaries from a small sample of nonprofit professionals; skews younger and smaller-org | 2026 site data |
| ZipRecruiter | ~$93,000 | Job-posting wage data; reflects what nonprofits offer for new hires, not what incumbent EDs earn | 2026 site data |
| Candid (IRS Form 990 aggregate) | $115,000 - $235,000 by org size | IRS Form 990 filings, the only legally required source; lags 12-18 months and excludes fringe benefits | 2022-2023 990 filings |
| Glassdoor | ~$205,000 | Self-reported, skews larger organizations and conflates “executive director” with “CEO” titles | 2026 site data |
| BLS Occupational Employment Statistics (Top Executives) | ~$103,000 median | Survey of employers across all industries, not nonprofit-specific | BLS 2023 release |
For a deeper breakdown of nonprofit executive director salary benchmarks by operating budget tier, geography, and program area, see the dedicated salary post; this section provides the source reconciliation that the salary post applies.
Salary by Operating Budget Tier
Drawing from Candid 990-derived data (2022-2023 filing year), median nonprofit ED total compensation runs approximately:
- Under $250K operating budget: $45,000 - $65,000 base salary; many small nonprofits operate with no paid ED
- $1M - $5M operating budget: $85,000 - $130,000 base salary plus benefits
- $10M and above: $175,000 - $300,000+ total compensation, with variance by program area and geography
These figures cover base salary. Total compensation packages add retirement contributions, health benefits, and (at larger organizations) deferred compensation. The IRS reasonable-compensation framework requires nonprofit boards to set ED pay against comparable organizations and document the comparability data; the compensation committee or full board approves the package, not the ED. Pay equity gaps persist: BoardSource Leading with Intent 2024 and Race to Lead 2024 both report compensation differentials by gender and race that exceed the variance attributable to organization size alone.
Nonprofit Sector Size and Executive Director Workforce Statistics
The United States has approximately 1.5 million registered nonprofit organizations, with the operational subset filing IRS Form 990 falling closer to 1.3 million. The nonprofit sector employs 12.8 million paid workers, equal to 9.9% of private-sector employment (BLS QCEW, 2022 data). The majority of registered nonprofits operate under $250K and have no paid executive director.
Approximately 1.5 million registered nonprofits in the United States, drawn from the IRS Tax Exempt Organization Business Master File. Not all are operationally active; the subset filing IRS Form 990 annually is closer to 1.3 million. National Council of Nonprofits estimates around 60% of registered nonprofits operate under $250K in annual operating budget, and a substantial share have no paid staff.
12.8 million paid jobs, equal to 9.9% of private-sector employment, per BLS Quarterly Census of Employment and Wages (2022 data). The figure has grown approximately 18% since 2007 and now exceeds U.S. manufacturing employment.
Who Is the “Executive Director” Population
The number of organizations with a paid ED is smaller than the registered count suggests. Organizations under $250K often run on volunteer leadership or pay an ED on a part-time or stipended basis. The full-time, paid nonprofit executive director population is concentrated at $500K and above operating budget. The salary, tenure, and burnout figures elsewhere on this page describe that paid-ED subset, not the entire registered-nonprofit universe.
Demographic Profile of Current EDs
The AECF Transitions Survey 2004 (22-year historical baseline) established the original demographic profile: predominantly white, predominantly women at small-to-mid organizations, predominantly men at large organizations. Building Movement Project Race to Lead 2024 provides current BIPOC representation data: representation of nonprofit leaders of color has grown over the last decade but remains below the demographic share of the populations many nonprofits serve. Aspirations to lead are higher among BIPOC nonprofit professionals than among white peers, but advancement rates lag - a pipeline pattern rather than an aspiration gap. BoardSource Leading with Intent 2024 reports a median board size of 15 directors. The BoardSource sample skews larger and professionally governed - a caveat that applies whenever BoardSource is cited.
Nonprofit Executive Director Burnout and Wellbeing Statistics
Approximately three-quarters of nonprofit EDs report significant stress or burnout signals, per Daring to Lead 2011 (CompassPoint, 15-year-old data; the canonical figure has not been replaced). Funding uncertainty, board conflict, and staffing pressure rank as the top stressors across multiple practitioner surveys. Definitional caveat: “burnout” is self-reported in some studies and measured by validated instruments (MBI, OLBI) in others, so cross-study comparisons require caution.
Reported burnout rate: approximately 75%. Daring to Lead 2011 (CompassPoint, n=3,000 EDs, 15-year-old data) reported that approximately three-quarters of nonprofit executive directors planned to leave their role within five years, with burnout cited as a leading driver. The figure remains the most-quoted burnout-adjacent statistic in nonprofit leadership literature because no comparably scoped national survey has replaced it.
Roughly one-third intend to leave the sector within 12 months. Chronicle of Philanthropy 2024 and NonprofitHR practitioner surveys report 30% to 40% of nonprofit chief executives consider leaving the sector entirely within a 12-month window during periods of funding pressure. Sector-leave intent runs higher than role-leave intent, suggesting burnout pushes leaders out of nonprofit work, not just out of a particular position.
Burnout is not pushing nonprofit leaders out of their jobs - it is pushing them out of the sector entirely.
Top-Ranked Stressors and Definitional Note
The stressor rank order is consistent across surveys (Daring to Lead 2011, 15-year age caveat; NonprofitHR more recent practitioner data):
- Funding uncertainty - the dominant stressor at every organization size below $10M
- Board conflict or misalignment - frequently cited as the proximate departure trigger
- Staffing pressure - especially acute post-2020, with hiring competition driving wage compression
- Personal financial pressure - a function of nonprofit pay relative to comparable for-profit roles
Burnout is defined inconsistently across the studies cited above. Daring to Lead used self-report items embedded in a broader survey. NonprofitHR instruments rely on self-report stress scales. Some recent academic work uses validated instruments such as the Maslach Burnout Inventory (MBI) or the Oldenburg Burnout Inventory (OLBI). The figures move as the definition shifts. Access to mental-health support is uneven; small nonprofits rarely fund Employee Assistance Programs or budget for executive coaching, so the population most at risk often has the fewest support resources. For prevention practices, see nonprofit executive director burnout rates; for transition-window vulnerability, see leadership transition statistics.
Nonprofit Executive Director Support and Professional Development Statistics
Most nonprofit executive directors at small organizations have no formal coaching or peer-cohort support. Estimated coaching access runs below 20% at organizations under $1M operating budget, and average professional development budgets in the same tier are typically under $2,000 per year (NonprofitHR, Bridgespan). The Daring to Lead 2011 “lonely at the top” data point still circulates because the underlying isolation pattern persists.
Coaching Access by Organization Size
Below 20% of nonprofit EDs at organizations under $1M operating budget receive professional coaching, based on practitioner-survey estimates from NonprofitHR and Bridgespan. The same population reports lower access to peer-cohort programs, sabbatical funding, and mental-health support. The structural pattern is access, not awareness: commercial executive coaching at $1,500 to $5,000 per hour or $15,000 to $50,000 per six-session engagement sits outside the compensation range of most small-org EDs. CNPC’s volunteer-coach model makes ICF-credentialed coaching accessible at $300 per six-session engagement; details at the CNPC executive coaching program page.
Professional Development Budgets and Isolation
Median ED professional development budget at organizations under $1M: under $2,000 per year. NonprofitHR and Bridgespan data indicate development budgets at small nonprofits cluster in the $500 to $2,000 range, often a line item within the broader administrative budget. At $5M and above, development budgets typically run $5,000 to $15,000+ per year.
Approximately 50% of nonprofit EDs report feeling isolated in their role, drawn from the Daring to Lead 2011 “lonely at the top” data point (CompassPoint, 15-year-old data). The figure persists in current literature because the underlying pattern persists: small-org EDs operate without internal peers and rarely have access to structured peer cohorts.
ED Performance Reviews and Coaching ROI
BoardSource Leading with Intent 2024 reports approximately 60% of nonprofit boards conduct a structured annual performance review of their executive director. Smaller, less-professionally-governed organizations review less frequently or not at all; the 60% figure likely overstates sector-wide practice given the BoardSource sample skew. The ICF Global Coaching Study reports a median 6x return on investment from professional coaching engagements across industries surveyed. The figure is sector-general, not nonprofit-specific; treat the multiplier as directional.
Nonprofit Board Governance and Executive Director Relationship Statistics
Board conflict ranks among the top three named drivers of nonprofit executive director departures across multiple search-firm and practitioner surveys. The median nonprofit board seats 15 directors (BoardSource Leading with Intent 2024). Fewer than one-third of nonprofit boards have a written ED succession plan in place, the same survey reports.
Board conflict drives a substantial share of ED departures. Kittleman 2025 and BoardSource Leading with Intent 2024 both name board-relationship breakdown as a leading driver of nonprofit ED resignations, alongside funding pressure and personal exhaustion. The two issues are related: ED-board misalignment on funding strategy or program priorities is among the most frequently cited departure triggers.
Median board size: 15 directors (BoardSource Leading with Intent 2024), with significant variation by organization size. The BoardSource sample skews toward larger, more professionally governed organizations. For board chairs reading the data here, see our companion piece on ED performance evaluation trends.
Communication Frequency and Board Onboarding
BoardSource Leading with Intent 2024 reports approximately 75% of nonprofit boards meet at least quarterly with the executive director, with most professionally governed organizations meeting monthly. The frequency drops sharply at small organizations, where ED-board interaction often happens through ad hoc check-ins rather than structured meetings. The lack of structure correlates with higher rates of board-relationship complaints in EDs who later leave the role. Approximately 60% of nonprofit boards provide structured onboarding to new board members (same survey). The 40% that do not are more likely to develop misalignment with the ED over time, since incoming directors lack a shared baseline on strategy, finances, or executive role definition.
Written Executive Director Succession Plans
Fewer than one-third of nonprofit boards have a written executive director succession plan in place (BoardSource Leading with Intent 2024). Bridgespan succession research describes it as the most consistently underaddressed governance practice across the sector. Most nonprofit boards will discover their succession-planning gap during a crisis transition rather than a planned one. Board size, meeting frequency, and succession planning correlate with longer ED tenure - they do not cause it on their own; they signal a board culture that supports the executive role rather than testing it.
Nonprofit Leadership Pipeline and Succession Statistics
Roughly half of nonprofit executive directors are external hires; the remainder are promoted internally or step in from a board role (Bridgespan; AECF 2004 baseline, 22-year-old data). Median prior nonprofit experience before becoming an ED is 10 to 15 years. The BIPOC pipeline gap documented by Race to Lead 2024 persists despite stated funder commitments to leadership equity.
External hire vs. internal promotion: roughly 50/50. Bridgespan’s pipeline research and the AECF Transitions Survey 2004 (22-year historical baseline) both report nonprofit executive director positions split approximately evenly between external hires and internal promotions, with a smaller share of board members or interim leaders stepping into the permanent role. Small organizations are more likely to promote internally; large organizations are more likely to run a national external search.
Median prior nonprofit experience: 10 to 15 years. First-time nonprofit executive directors typically arrive with a decade or more of nonprofit-sector experience, often in program or development roles (Bridgespan; AECF 2004, 22-year historical baseline). For first-time ED-specific guidance, see our practical companion on the first-time nonprofit executive director role.
Demographic Trends and Funder Investment
Building Movement Project Race to Lead 2024 documents a persistent BIPOC pipeline gap. Aspirations to lead are slightly higher among nonprofit professionals of color than among white peers, but advancement rates to the executive director role lag substantially. Race to Lead frames this as a pipeline-blockage pattern rather than an interest gap, with hiring and board composition cited as the two largest structural barriers. Millennial and Gen Z professionals make up a growing share of the pipeline.
Bridgespan’s “Plenty of Pipeline?” research describes chronic underinvestment by foundations in leadership development funding. The percentage of grant dollars explicitly directed to leadership development sits in the low single digits across most major foundation portfolios. The succession-plan gap noted earlier compounds the problem: without written plans, nonprofits cannot identify and develop internal successors systematically. For strategic implications, see nonprofit succession planning gaps.
What the Data Shows Works: Retention, Coaching, and Organizational Support
The ICF Global Coaching Study reports a 6x median return on investment from professional coaching engagements (sector-general data, not nonprofit-specific). Peer-cohort participation correlates with longer ED tenure (Daring to Lead 2011, 15-year-old data). Board investment in ED development correlates with longer tenure (Bridgespan). Volunteer-coach models bring credentialed coaching within the development budget of small nonprofits where commercial rates are unaffordable.
Coaching ROI: The 6x Median Benchmark
The ICF Global Coaching Study reports a median 6x return on coaching investment across industries surveyed, with productivity gains, retention improvements, and reported leadership effectiveness as the most-cited measurable outcomes. The figure is sector-general, not nonprofit-specific; treat the multiplier as directional. No comparably scoped outcome study has been published for the nonprofit sector specifically.
Tenure, Peer Cohorts, and Board Investment
Direct comparison data on tenure for coached vs. uncoached nonprofit EDs is limited. Daring to Lead 2011 (15-year-old data) reported that EDs with peer-cohort or coaching support reported lower stress and higher tenure intent than those without. The finding is correlational, not causal, and the underlying support landscape has shifted in the years since. Bridgespan’s board-investment research links board-funded leadership development to longer ED tenure, consistent with the coaching pattern but not isolating coaching as the variable. Peer-cohort participation - structured peer-coaching groups, ED roundtables, or professional learning communities - correlates with longer tenure across multiple practitioner surveys. The Daring to Lead “lonely at the top” pattern (15-year-old data) maps directly onto the support gap that peer cohorts address.
The CNPC Model and the Affordability Argument
A 6x coaching ROI means nothing to an ED whose development budget is $500 and whose cheapest option costs $15,000.
The Center for Nonprofit Coaching connects nonprofit executive directors with ICF-credentialed volunteer coaches, with engagements priced at $300 for a six-session program at the entry tier. The volunteer-coach model brings credentialed executive coaching for nonprofit leaders within the professional development budget of organizations otherwise priced out of commercial coaching. At commercial rates of $1,500 to $5,000 per hour, a comparable engagement runs $15,000 to $50,000 - outside the $500 to $2,000 development budget that NonprofitHR documents at small nonprofits. At $300 per six-session engagement, the access barrier collapses.
CNPC connects nonprofit EDs with ICF-credentialed volunteer coaches. Engagements start at $300. Apply now.
Quick-Reference Statistics Table: All Key Nonprofit ED Figures
A scannable cheat sheet of every key nonprofit executive director statistic on this page, with named source and year of data collection on every row. The Year column distinguishes current data from historical baselines. For full methodology and source links, see the sections above.
| Statistic | Value | Source | Year |
|---|---|---|---|
| Average ED tenure (sector-wide) | 5-7 years | Daring to Lead (CompassPoint) | 2011 (historical baseline) |
| ED tenure at orgs under $250K | 3-5 years | Daring to Lead (CompassPoint) | 2011 (historical baseline) |
| Nonprofit CEO departures | Record levels | Kittleman 2025 CEO Departures report | 2025 |
| Chief executives intending to leave within 2 years | ~33% | Chronicle of Philanthropy CEO survey | 2024 |
| Median ED vacancy duration | 4-6 months | Avra Search nonprofit hiring trends | 2025 |
| ED search firm fees (small-mid) | $25K-$50K | Avra Search; Kittleman | 2025 |
| PayScale reported ED salary | ~$82,000 | PayScale (self-reported, small sample) | 2026 |
| ZipRecruiter reported ED salary | ~$93,000 | ZipRecruiter (job postings) | 2026 |
| Candid IRS Form 990 ED salary range | $115K-$235K | Candid 990 aggregate | 2022-2023 |
| Glassdoor reported ED salary | ~$205,000 | Glassdoor (skews large orgs and CEO titles) | 2026 |
| BLS Top Executives median wage | ~$103,000 | BLS Occupational Employment Statistics | 2023 |
| ED salary at orgs under $250K | $45K-$65K base | Candid IRS Form 990 aggregate | 2022-2023 |
| ED salary at orgs $1M-$5M | $85K-$130K base | Candid IRS Form 990 aggregate | 2022-2023 |
| ED salary at orgs $10M+ | $175K-$300K+ total comp | Candid IRS Form 990 aggregate | 2022-2023 |
| Registered U.S. nonprofits | ~1.5 million | IRS Tax Exempt Organization Master File | 2025 file |
| Nonprofit sector paid jobs | 12.8 million | BLS Quarterly Census of Employment and Wages | 2022 |
| Nonprofit share of private-sector employment | 9.9% | BLS Quarterly Census of Employment and Wages | 2022 |
| EDs reporting burnout signals | ~75% | Daring to Lead (CompassPoint) | 2011 (historical baseline) |
| EDs intending to leave sector within 12 months | 30-40% | Chronicle of Philanthropy; NonprofitHR | 2024 |
| EDs reporting role isolation | ~50% | Daring to Lead (CompassPoint) | 2011 (historical baseline) |
| Boards conducting structured ED review | ~60% | BoardSource Leading with Intent | 2024 |
| Boards with written ED succession plan | Under 33% | BoardSource Leading with Intent | 2024 |
| Median nonprofit board size | 15 directors | BoardSource Leading with Intent | 2024 |
| Coaching access at orgs under $1M | Below 20% | NonprofitHR; Bridgespan | 2024 |
| Median ED PD budget at orgs under $1M | Under $2,000/year | NonprofitHR; Bridgespan | 2024 |
| Median coaching ROI (sector-general) | 6x | ICF Global Coaching Study | 2020 |
For full methodology and source links, see the sections above.
The Statistics Point to One Structural Gap: Access to…
Seventy-five percent of nonprofit EDs report burnout signals. Fewer than one-third of their boards have a succession plan. Commercial coaching runs $15,000 to $50,000 per engagement — outside…
Apply for Coaching →